
Convexion
Background
Convexion was a bushfire Software as a Service (SaaS) product that integrated bushfire tools into a web app to allow users to understand landscape scale risk with minimal friction. The product was developed by RedEye Apps, a Brisbane based startup that develops software for large asset owners. The product was responsible for static landscape analysis using fire history, fuel load and weather data, as well as dynamic fire simulation using Phoenix RapidFire. Much of this was built on top of knowledge provided by the data scientists and qualified Fire Behaviour Analysts (FBANs) at RedEye.
Role
I was the technical lead for the project (2019-2023), leading a development team of 4. We used an Scrum / Agile methodology and worked in a hybrid remote / in person environment. I was responsible for the architecture of the system, as well as the development of the backend services.
Tech Stack
- Java / Springboot
- Python / Flask / Xarray / GDAL
- PostgreSQL / PostGIS
- Docker / Mesos / AWS
Challenges & Solutions
Tiling was a significant challenge for the project. Without much guidance, we had to implement strategies so that a browser could display map data quickly. This was a trivial problem for raster data, but for vector data there is not such widely adopted solutions. We chose to use the Mapbox Vector Tile format, which is an open specification for a binary format for tiled vector data. We used the Postgis API for generating these tiles and a custom Leaflet plugin to display them on the browser. The result was fast, cacheable vector data that could be displayed in the browser.
Phoenix was a difficult tool to integrate. It is a legacy tool written in C# that was closed source and had only a command line interface with minimal documentation. This tool was eventually integrated into the platform, running inside a docker container that was orchestrated by Mesos as a single shot task. This allowed us to run the tool on demand, and scale it up to run multiple simulations in parallel, given the architectural constraints placed on us at the time. The result was a user being able to execute a simulation in the cloud and any user from their organisation could view the results of the simulation in their browser.
The Meteogram was a tricky challenge as well. The amount of raster data was enormous, and using the Cloud Optimised GeoTIFF (COG) format was excellent for serving tiles to the browser, but very poor for extracting a time series at a point. We ended up using a GeoTIFF format that was not cloud optimised - a copy of the data - but with band interleaved by pixel, rather than band interleaved by line. This reduced the amount of overscan when extracting a time series, as all the data for a given pixel was written sequentially in the file rather than scattered throughout it. The result was a meteogram that could be generated in sub-second, rather than 30+ seconds.
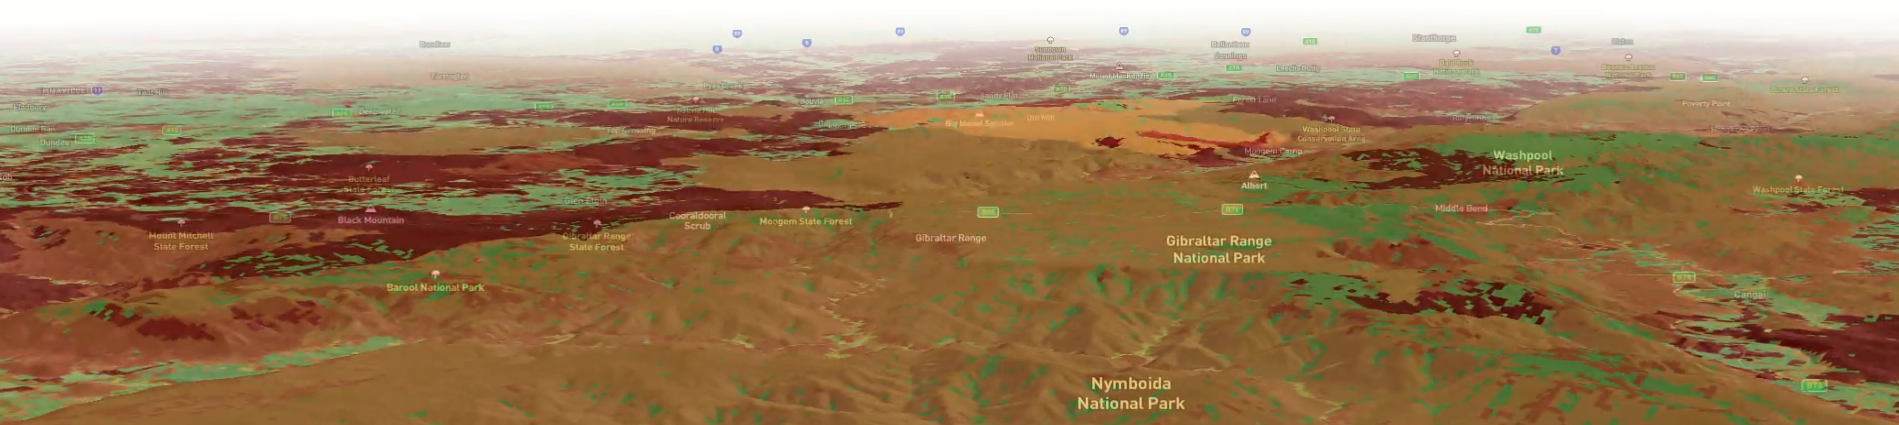
 A dynamic simulation of a fire spread over 24 hours